
VisDeck
Compose · Connect · Defend
See your data take shape
A 160-card deck for learning how to design information visualizations, one decision at a time, built for the Information Visualization course at Técnico Lisboa.
A 160-card deck for learning how to design information visualizations, one decision at a time, built for the Information Visualization course at Técnico Lisboa.
Most untrained people build visualizations by memorizing chart names and matching them to data. VisDeck works differently. Each card is one decision in the design process: the question you're asking, the kind of data you have, the mark that will represent it, the channel that will encode a value.
Cards connect through a port-and-symbol system printed right on their edges. If two cards don't share a matching port, they don't fit together, and you'll be able to spot it and fix it before it becomes a problem. Besides that, there are no "right" or "wrong" choices. There is only a design you can build, explain, and defend.
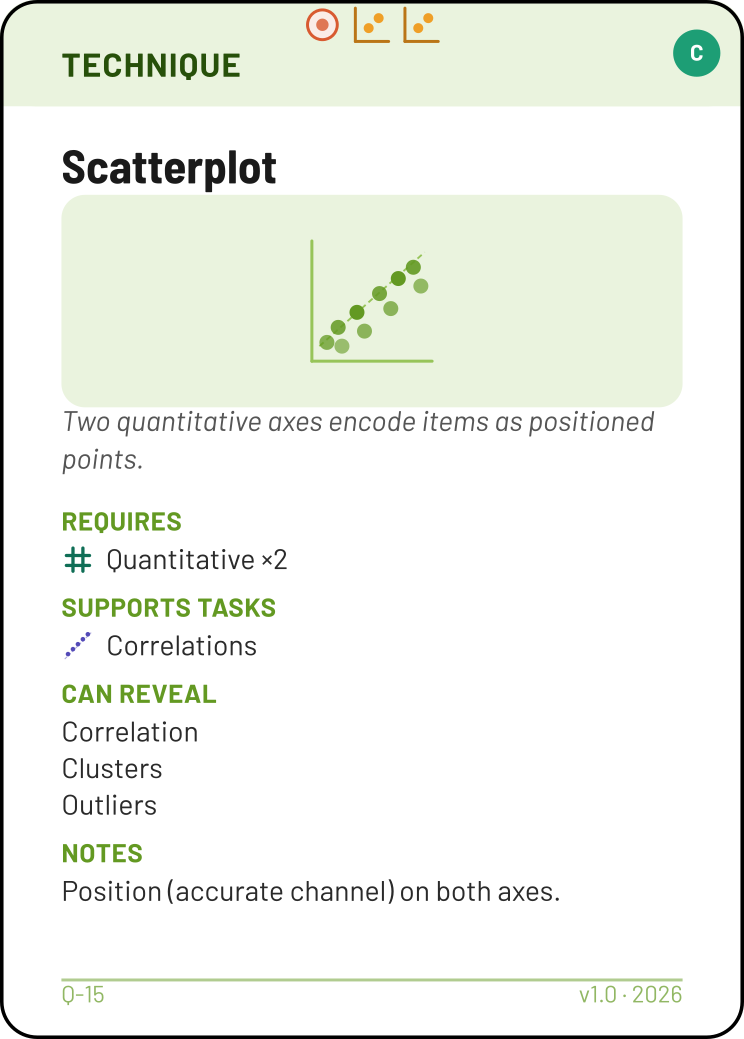
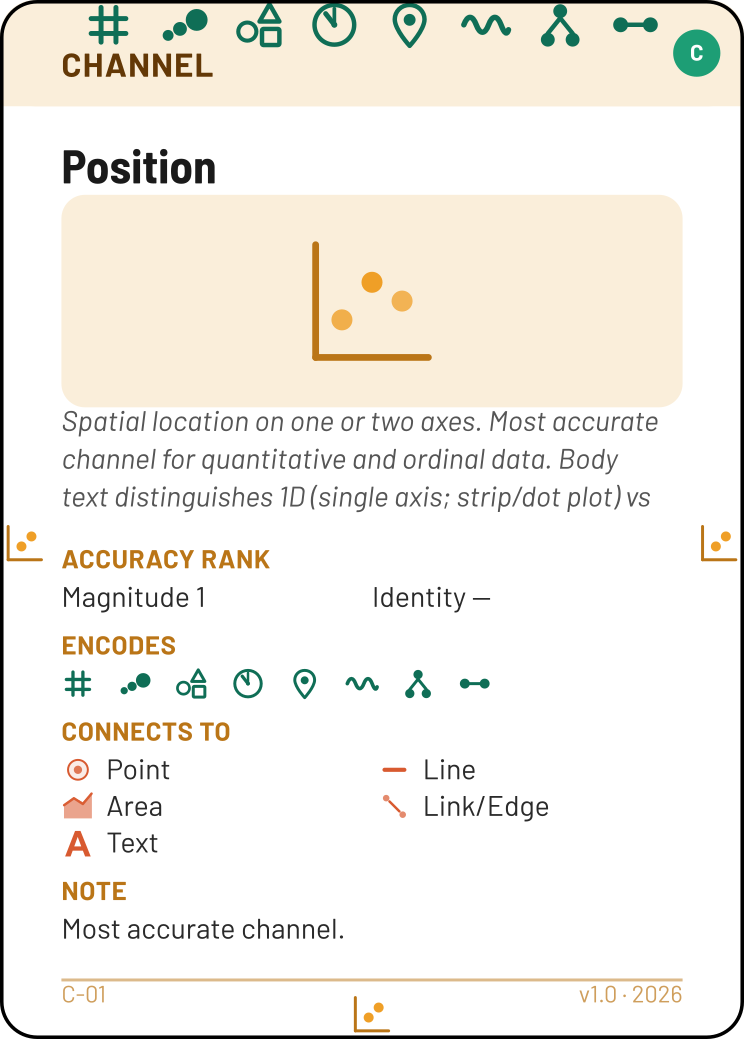
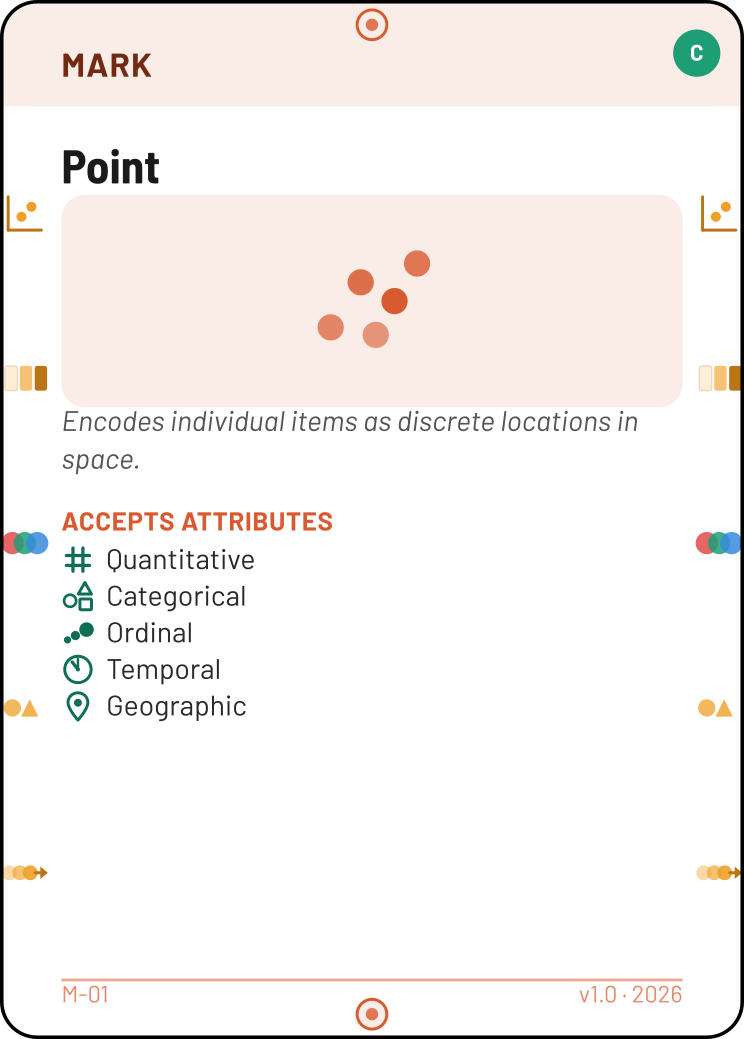
Start from a Task card: the question you want the data to answer. Add Attribute cards for the variables you have, then build outward through Marks, Channels, and a Technique until you have a complete assembly on the table.
Every card edge carries ports. A Technique card only accepts the Mark and Channel combination printed on its top edge. If your assembly doesn't match, the cards themselves show you where the design breaks down, before you've drawn a single pixel.
Once the layout is valid, you talk through it: what you expected to see, why this encoding is the right one, what risk a warning card is covering. The reasoning is what matters, not the chart.
Every card belongs to one of ten categories, each with its own colour and its own job in the assembly. Some are required for every design, others are optional refinements you add once the basics are in place.
The question you're trying to answer. Always the first card on the table.
The type of a variable in your data: quantitative, categorical, temporal, geographic, and more.
A data operation applied before encoding: aggregate, bin, rank, or fit a model.
The visual representation of each data item: point, line, area, link, or text.
The visual property that carries a value: position, length, colour, size, shape, and more.
A named chart, from Bar Chart to Sankey Diagram, that validates the assembly above it.
A composition applied on top: stack, facet, overlay, small multiples, focus + context.
A hypothesis about what the design should reveal, stated before anything is plotted.
A design rule: either a warning to cover, or the justification for a deliberate exception.
A declared behaviour supporting exploration: filtering, brushing, drill-down, and more.
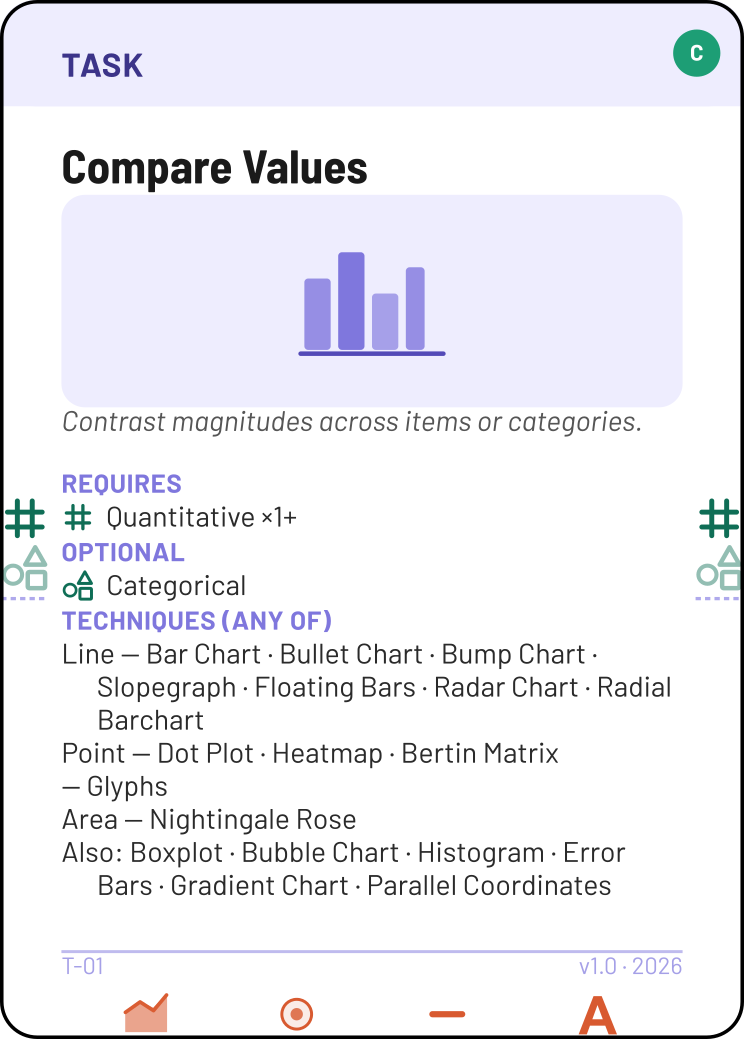
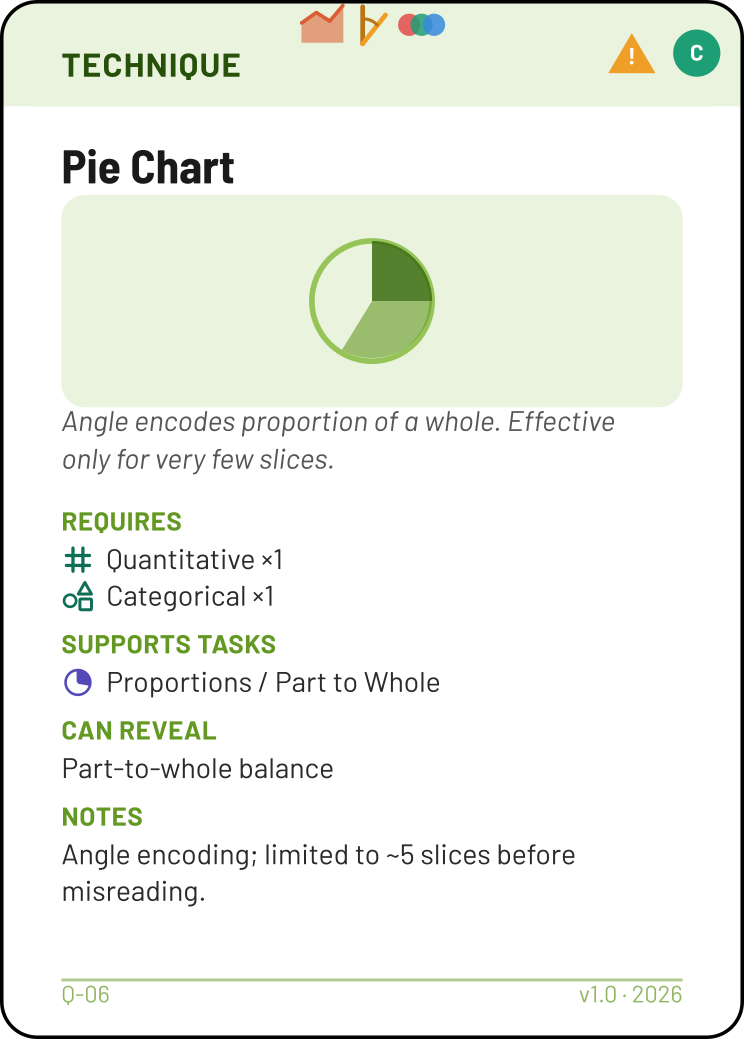
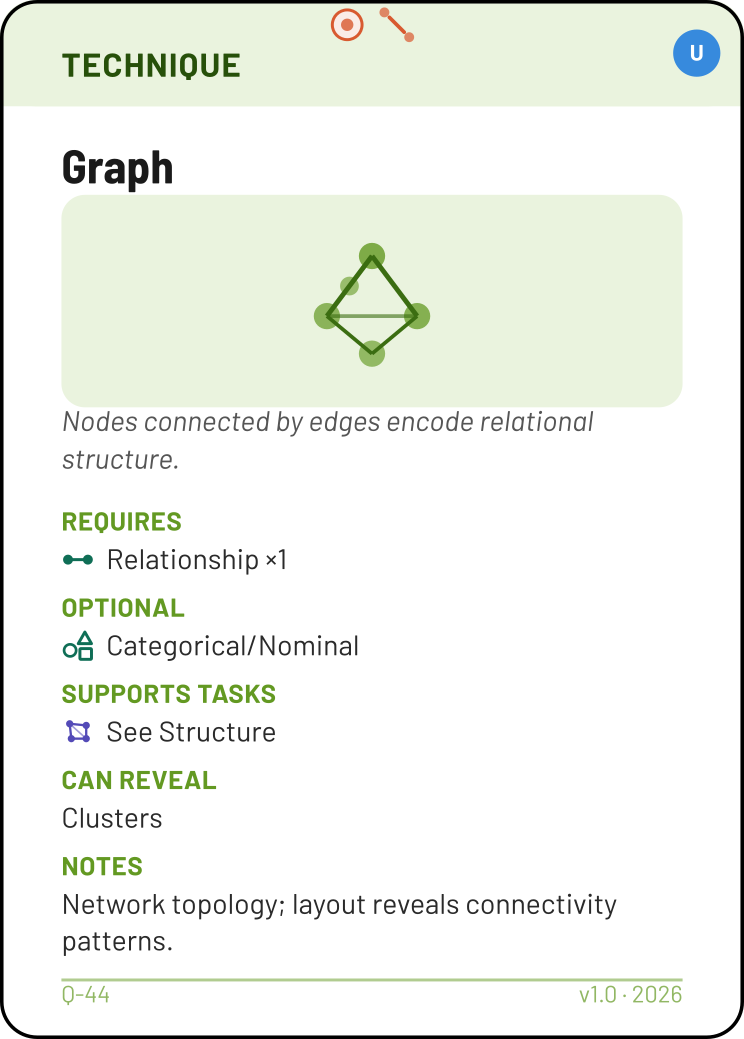

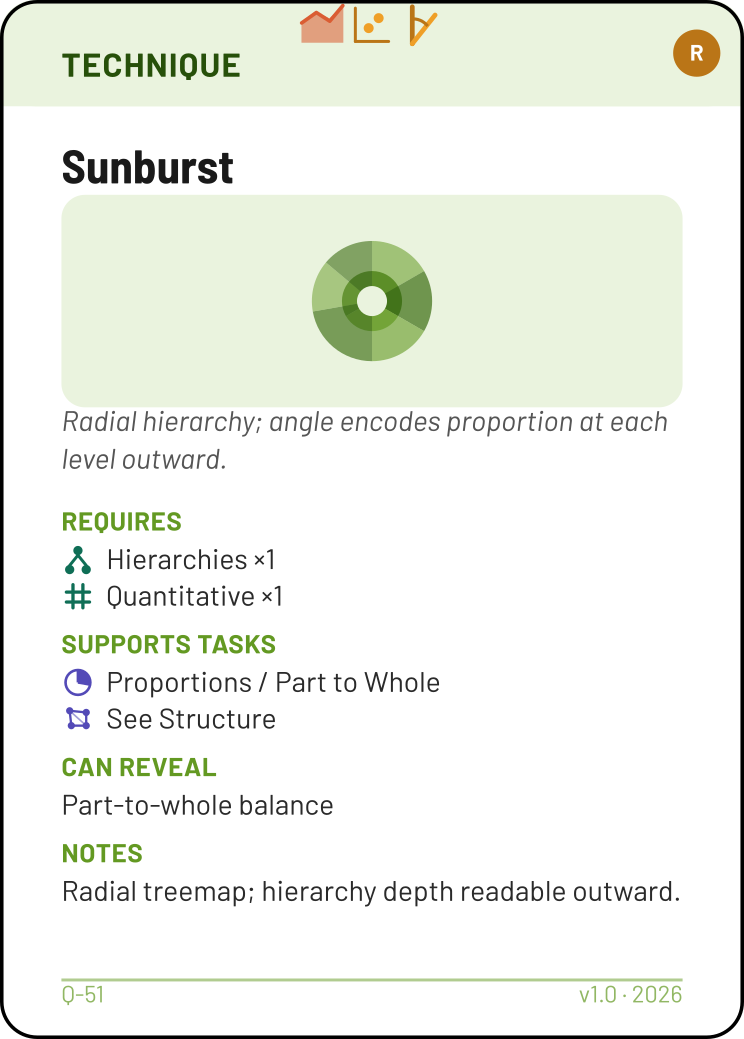

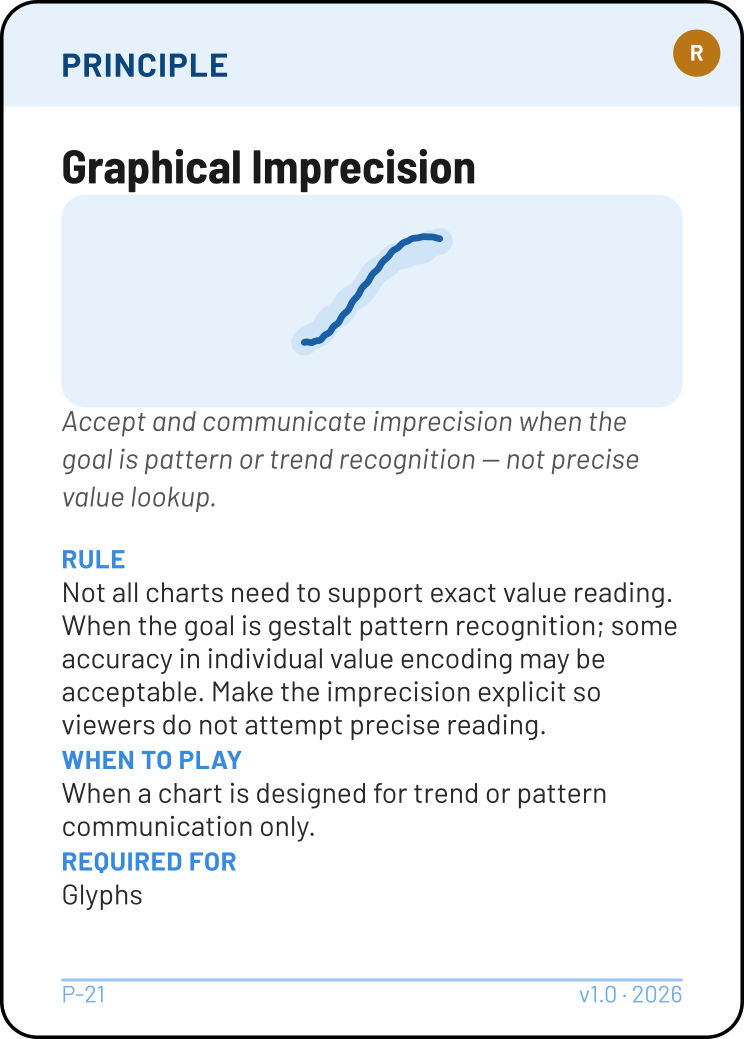
63 techniques in total, from the familiar to the rarely taught.
Some cards carry a warning. A pie chart with too many slices, an overlay that risks occlusion, a rose chart that distorts area for value: the deck doesn't stop you from playing them, but it does require a Principle card justifying why the risk is worth taking in your specific design. Explaining that trade-off well is worth more than avoiding it.
The full rules, card anatomy, and worked examples live in the Student Guide. Prefer to watch a design come together first? The tutorials page walks through a full assembly, card by card.